


How to Add External JavaScript Libraries to Flowise for Custom Chatbot Tools
Artificial Intelligence Development


Looker Studio is a powerful reporting tool that you can use to build compelling visualizations and reports using a myriad of out of the box connectors, but has a rather poor integration story with Google Play Store metrics. What this means is that for Android app developers who want to build a slick Looker Studio report about their app’s meteoric growth and revenue numbers, they are pretty much out of luck when it comes to using Looker Studio.
For example, if you want to report on any metrics such as number of installs, daily revenue and active subscribers within Looker Studio, there is no easy way to do this out of the box. In this tutorial, I will show you how you can use a little bit of code to extract data from Google Play and publish it so that it can be consumed by Looker Studio.

At a high level, the approach to integrating Google Play metrics into Looker Studio involves the following the steps:
We can automate all 3 of the above steps using a bit of sweat, Python and Dockerization.
You can find a full set of source code and instructions on how to run it on your own local machine as well within a Docker container in this GitHub repo. The rest of the blog post will go into further detail on how this source code works.
To say that there is no integration between Google Play and Google Analytics is a bit of a misnomer. You can setup a link between your Google Play account and Google Analytics using the steps provided by Google here. However, Google Play only publishes the following events:
| Event | Description |
|---|---|
| in_app_purchase | Published when someone makes a purchase in your app or starts a subscription (free trial or paid) |
| app_store_subscription_convert | Published when a free trial subscription converts into a paid subscription. |
| app_store_subscription_renew | When an existing subscription renews for an additional period. |
That’s not a lot of data, certainly not enough to build a comprehensive report on your app’s revenue and subscription performance.
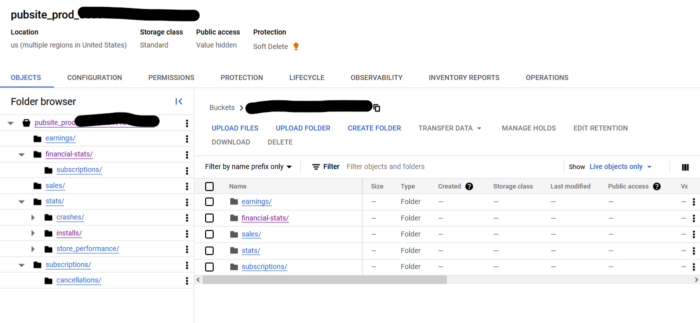
The heart of the method I am demonstrating involves automating access to a set of daily reports created by Google Play automatically stored on a Google Cloud Storage bucket associated with your Google Play developer account. Within a Google Play developer account, if you go to “Download Reports”, you will see that there are monthly CSV reports that Google Play makes available for Reviews, Statistics and Financials. These reports are monthly break downs, but they are updated automatically overnight by Google. The data contained in these CSVs is not accessible anywhere else in the Google Play Developer API.
Here are the steps to access these reports:
Now that we’ve identified the files we will be working with, let’s proceed to proverbial meat and po-ta-toes of this exercise.
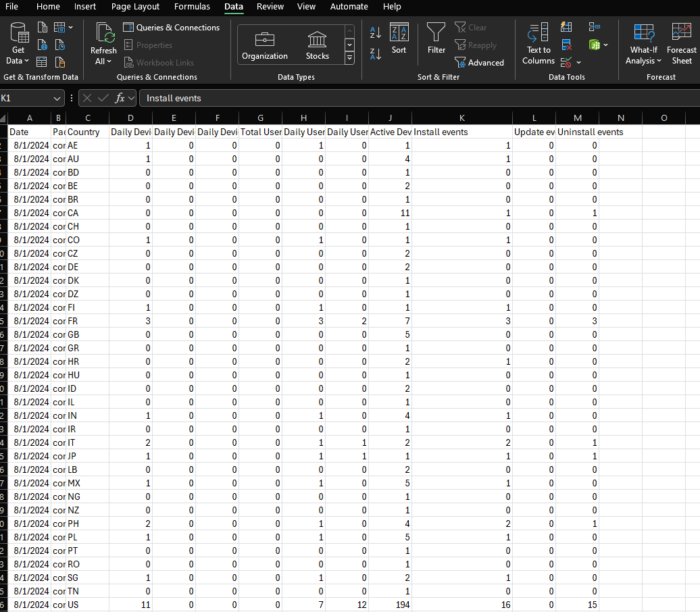
Let’s walk through how you can automate the download of the install metrics for an app on Google Play to Looker Studio by automating the download of these nightly reports. In the Google Cloud Storage bucket, if you expand the installs folder, you will a set of CSV files for every different app identifier in your account, grouped by the month and year. For our example, we are interested in the CSV file with the name installs_<app identifier>_YYYYmm-country.csv. This file is updated every night and has daily metrics for a variety of install related metrics grouped by country.
In this step, we are going to create a very simple Python script, that will use the Google cloud service account file you created and downloaded as part of the prerequisites to download the latest version of the above CSV file, calculate a total number of installs globally and then publish that into a Google Sheet. You can find all of the source code below and detailed instructions to run them in this GitHub repo.
The following is what the download_install.py file within the repo looks like:
from google.cloud import storage
from google.oauth2 import service_account
from google.oauth2.credentials import Credentials
import os
import datetime
import pandas as pd
import gspread

#This snippet is intended to run in a Docker container and assumes the following data paths are mapped
#local folders that contain the relevant information.
credentials_path = "/app/data/google-credentials.json"
download_folder = "/app/data/installs/"


credentials = service_account.Credentials.from_service_account_file(credentials_path)

start_date = datetime.datetime.strptime(os.getenv('START_DATE'), '%Y-%m-%d')
start_date_time = datetime.datetime.now()
print(f"\INSTALLS UPDATE: Start of execution at  {start_date_time}")

spreadsheet_id = os.getenv('SPREADSHEET_ID')
worksheet_id = os.getenv('INSTALLS_WORKSHEET_NAME')
package_name = os.getenv('PRODUCT_ID')
# Initialize a client
client = storage.Client(credentials=credentials)
bucket_name = os.getenv('PLAY_STORE_BUCKET_NAME')

def download_blob(bucket_name, source_blob_name, destination_file_name):
    """Downloads a blob from the bucket."""
    # Get the bucket object
    bucket = client.bucket(bucket_name)

    # Get the blob object
    blob = bucket.blob(source_blob_name)

    # Download the blob to a local file
    blob.download_to_filename(destination_file_name)

    print(f"Downloaded storage object {source_blob_name} from bucket {bucket_name} to local file {destination_file_name}.")

#Create a string that is a date in the format of YYYYMM based on today's date
today = datetime.datetime.today()
today = today.strftime('%Y%m')

#Get the days before today to update install data for
days_before_today = int(os.getenv('DAYS_TO_FETCH_INSTALLS_FOR'))
earliest_date_to_fetch = datetime.datetime.today() - datetime.timedelta(days=days_before_today)
#set to midnight of that date
earliest_date_to_fetch = earliest_date_to_fetch.replace(hour=0, minute=0, second=0, microsecond=0)

#Now lets get the installs for the current month
filename = f'installs_{package_name}_{today}_overview.csv'
destination_filename = f'{download_folder}{filename}'
download_blob(bucket_name, f'stats/installs/{filename}', destination_filename)

#Now we need to convert this csv to a pandas dataframe
df = pd.read_csv(destination_filename, encoding='utf-16')

#We then want to take the dataframe and upload it to a google sheet, overwriting any data for the Date that
#already exists in the Google Sheet
#First we need to authenticate to Google Sheets
credentials = service_account.Credentials.from_service_account_file(credentials_path,
                                                                    scopes=['https://www.googleapis.com/auth/spreadsheets'])
client = gspread.authorize(credentials)


# Open the Google Sheet
spreadsheet = client.open_by_key(spreadsheet_id)

# Get the worksheet
worksheet = spreadsheet.worksheet(worksheet_id)

# Go through each Date in the Pandas dataframe and update the Google Sheet with the data for that date
for index, row in df.iterrows():
    date = row['Date']
    date_obj = datetime.datetime.strptime(date, '%Y-%m-%d')
    date = date_obj.strftime('%m/%d/%Y')

    #If date is before the start date, skip
    if date_obj < start_date:
        print (f"Skipping date {date} as it is before the start date {start_date}")
        continue

    #If date is before the earliest date to fetch, skip
    if date_obj < earliest_date_to_fetch:
        print (f"Skipping date {date} as it is before the earliest date to fetch {earliest_date_to_fetch}")
        continue

    cell = worksheet.find(date, in_column=1)
    if cell:
        cell_row = cell.row
        cell_col = cell.col
        #remove the Date column from the row
        row = row.drop('Date')
        worksheet.update(f'A{cell_row}', [[date]+list(row)])
    else:
        #remove the Date column from the row
        row = row.drop('Date')
        worksheet.append_row([date]+list(row))

end_time = datetime.datetime.now()
duration = end_time - start_date_time
print(f"INSTALLS UPDATE: Finished at {end_time} and took {duration} to execute.")
The above code when run will update the Google Sheet that is set with in the SPREADSHEET_ID environment variable with the following data:
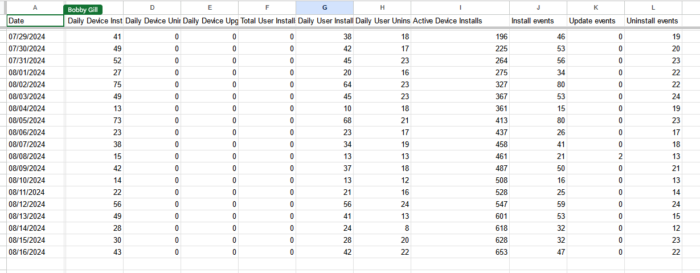
Now that our install data is in a Google Sheet, we can then easily setup an integration into Looker Studio in the next step.
In this step, we will setup the connection between a Looker Studio report and the Google Sheet our Python script is updating.
Assuming you already have an existing report you want to integrate this install data into:
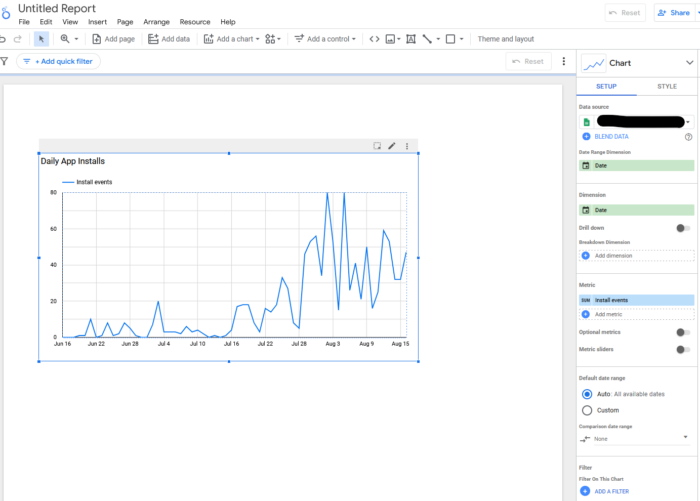
Once you’ve added your data source you are pretty much done. You can now manipulate and visualize the data just like you would data coming from Google Analytics or any other source. For example, if you want to create a line chart that shows the number of installs per day for your app you can do the following:
With the above you should now see a time series graph showing your daily installs for your app:
In the above example I’ve shown you how to publish install metrics to Looker Studio via Google Sheets. However, this general approach of automating the download and transformation of Google Play maintained data can be expanded upon very easily to enable you to report on a variety of Google Play metrics in Looker Studio, such as:
All of the code I’ve demonstrated above are apart of a open-source GitHub repository that you can locally on your machine and expand as you see fit.