


The CISO Framework for LLM-Powered, Agentic Security Operations
Generative AI


From self-service support chatbots, to providing personalized customer interactions via human support agents, generative AI is fundamentally reshaping the way organizations support and service their customers. While the dream offered by generative AI is often vivid and alluring, how can organizations actually measure the ROI of generative AI (GenAI) investments made in customer service and support?
At BlueLabel, we have seen firsthand the transformative power of these technologies in our work with our clients looking to increase the satisfaction and efficiency of their customer service initiatives. While we’ve found that the impetus to invest in GenAI and do something with it is quite high, however, the question remains: How do we measure the tangible benefits of these investments?
With that question in mind, I’m pleased to share in this post the Customer Interaction Efficiency Index (CIEI), a framework we’ve developed at BlueLabel to help organizations measure the ROI of generative AI investments within their customer service and support organization. In this post, I will briefly outline the CIEI index, the dimensions it measures, and how to interpret and visualize it. Finally, I’ll walk through an example of how to use the CIEI in real-life to measure a GenAI project’s ROI.
The CIEI framework is a very simple framework to evaluate the efficiency and effectiveness of customer service organizations who are embarking, or have already deployed, a generative AI support solution such as a support chatbot. It encompasses six critical components, each representing a key aspect of customer service performance. The CIEI, at its heart, is a weighted average score of these six components, based on weights adapted to your organization’s priority for each metric. Let’s take a look at the metric involved in the calculation of the CIEI:
FCR measures the percentage of customer inquiries resolved on the first interaction, without requiring follow-ups. A high FCR is indicative of effective service delivery, reducing operational workload and enhancing customer satisfaction. GenAI’s ability to accurately address common queries directly influences this metric.
ART reflects the average time taken to resolve customer issues. With GenAI, a significant reduction in ART is often observed, as AI systems handle inquiries swiftly, allowing human agents to focus on more complex issues. This metric is crucial for evaluating the speed and efficiency of service delivery.
The CSAT score is a direct measure of customer satisfaction with the service received, mostly often solicited through a survey or automated prompts after a support call. At BlueLabel, we prioritize this metric as it correlates strongly with customer loyalty and retention. A successful GenAI implementation often results in improved CSAT scores, as customers appreciate quicker and more accurate responses.
The Cost per Interaction (CPI) metric assesses the cost efficiency of customer service operations. GenAI can significantly reduce the cost per interaction by automating tasks that previously required human intervention. Monitoring this metric helps organizations understand the financial impact of AI technologies.
The transfer rate indicates the percentage of interactions initially handled by AI that are escalated to human agents. A lower transfer rate suggests that the AI system effectively resolves more inquiries, minimizing the need for human involvement. This metric is vital for assessing the capability of GenAI to handle customer inquiries independently.
Total Interaction Capacity (TIC) measures the maximum number of customer interactions the organization can handle, encompassing both AI and human resources. GenAI’s scalability is a critical advantage, enabling organizations to manage higher volumes of interactions without proportional increases in human resources.
The CIEI is calculated by normalizing each component to a 0-100% scale, then taking a weighted average of these normalized scores. For simplicity, we typically use equal weighting for each component, but weights can be adjusted based on organizational priorities.
$$
\text{CIEI} = \frac{1}{N} \sum_{i=1}^{N} w_i \cdot \text{Metric}_i
$$
Where:
$$ N \text{ is the number of components (in this case, 6).} $$
$$ w_i \text{is the weight assigned to each component metric.} $$
Assuming weights of 1 for each components, then the formula can be simplified to:
\begin{flalign*}
\text{CIEI} = \frac{1}{6} (\text{FCR} \\+ \text{ART} + \text{CSAT} \\+ \text{CPI} \\+ \text{Transfer Rate} \\+ \text{TIC})
\end{flalign*}
This formula provides a unified score reflecting the overall efficiency and effectiveness of the customer service operations, taking into account both AI and human elements. The higher the CIEI score, the more efficient and effective the customer service system is considered to be. This index allows organizations to track performance improvements and make informed decisions about further investments in AI technologies.
To illustrate the application of the CIEI framework, consider a case study from our client engagements where a generative AI powered chatbot was deployed as a first line self-service support tool for nationwide field operations team. You will see one column “Pre-Project” which shows each metric as it existed prior to the GenAI project, and the “Post-Project’ column shows those metrics after the implementation of the project:
| Component | Pre-Project | Post-Project |
|---|---|---|
| First Contact Resolution (FCR) | 70% | 85% |
| Average Resolution Time (ART) | 600 seconds | 450 seconds |
| Customer Satisfaction (CSAT) | 4.0/5.0 | 4.5/5.0 |
| Cost per Interaction (CPI) | $5.00 | $4.00 |
| Transfer Rate | 35% | 30% |
| Total Interaction Capacity (TIC) | 1,000/day | 1,500/day |
In order to calculate the CIEI, we need to normalize the values of each measurement so that the components are all, more or less, measured on the same scale. In this case, the simplest approach is to convert everything to a value between 0 and 1, so that larger values indicate positive trends. There are any number of ways to skin the normalized cat, so don’t get too hung up on why I used certain normalization formulas in this calculation.
The below table shows the normalization formula we can use to take the raw value for each component and map it into a percentage value.
| Component | Normalization Formula |
|---|---|
| First Contact Resolution (FCR) | – |
| Average Resolution Time (ART) | $$ 1 – \frac{\text{ART}}{\text{Max ART}} $$ |
| Customer Satisfaction (CSAT) | $$ \frac{\text{CSAT}}{5} $$ |
| Cost per Interaction (CPI) | $$ 1 – \frac{\text{CPI}}{\text{Max CPI}} $$ |
| Transfer Rate to Human Agents | $$ 1 – \frac{\text{Transfer Rate}}{100} $$ |
| Total Interaction Capacity (TIC) | $$ \frac{TIC(x)}{(TIC(Pre)+TIC(Post))} $$ |
Using the normalization formulas shown above, we can then calculate the pre- and post- project normalized value for each component:
| Component | Normalized Pre-Project Value | Normalized Post-Project Value |
|---|---|---|
| First Contact Resolution (FCR) | .70 | .85 |
| Average Resolution Time (ART) | .40 | .55 |
| Customer Satisfaction (CSAT) | .80 | .90 |
| Cost per Interaction (CPI) | .50 | .60 |
| Transfer Rate to Human Agents | .65 | .70 |
| Total Interaction Capacity (TIC) | .37 | .63 |
With the normalized values above, we can calculate the pre and post project CIEI scores:
\begin{align*}
\text{CIEI}_{\text{Pre}} = \frac{1}{6} (.70 + .40 + .80 \\+ .50 + .65 + .37) \\= \frac{372}{6} = .57
\end{align*}
\begin{align*}
\text{CIEI}_{\text{Post}} = \frac{1}{6} (.85 + .55 + .90 \\+ .60 + .70 + .63) \\= \frac{460}{6} = .71
\end{align*}
The substantial increase in the CIEI score from .57 to .71 clearly illustrates the efficiency and effectiveness gains achieved through the implementation of Generative AI.
While the single numerical calculation of CIEI is a good measurement of the impact of a customer service GenAI initiative, it is by no means the most powerful. To really understand the impact a generative AI initiative has had on a customer service organization, it is helpful to take the individual component scores of the CIEI and plot them on a radar chart for a really cohesive visualization of the impact of a generative AI project.
Taking our case study example above yields the following radar plot overlaying the pre and post CIEI scores:
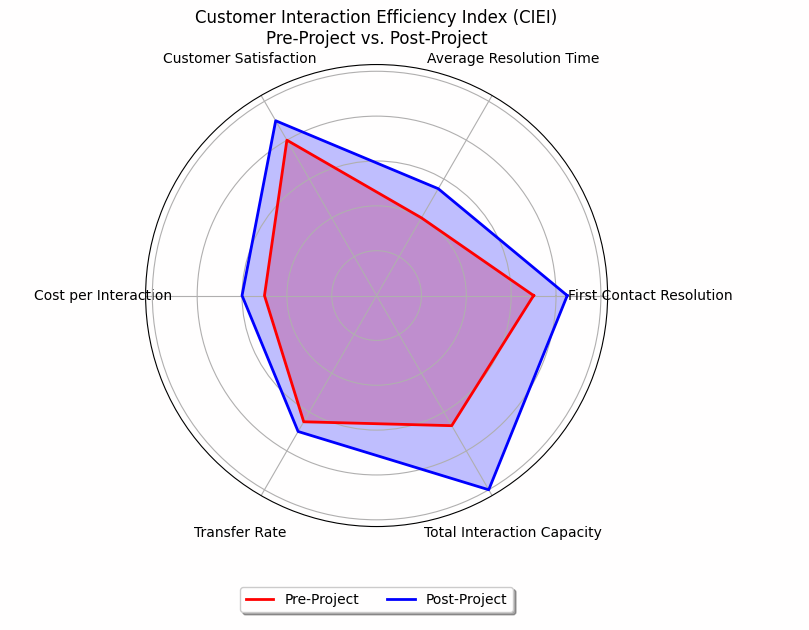
The radar chart visualization of the pre and post project CIEI is an extremely powerful communication and decision making tool. By plotting both pre-project and post-project metrics on the same chart, the radar chart effectively showcases the changes and improvements resulting from GenAI implementation. The visual contrast between the two polygons—typically smaller and less expansive pre-project, and larger post-project—clearly demonstrates areas of enhancement.
Further, a radar plot of CIEI makes it easy to spot outliers—metrics that deviate significantly from others. For example, if the ‘Transfer Rate to Human Agents’ shows little improvement compared to other metrics, it suggests an area where AI implementation may not have been as effective or opportunities for further investment.
Additionally, the CIEI plot can guide decisions on resource allocation. A significant improvement in ‘Total Interaction Capacity’ suggests that existing infrastructure can support higher volumes, potentially reducing the need for additional human resources.
At BlueLabel, we believe that measuring the ROI of GenAI investments is essential for maximizing their potential. Prior to making the decision to invest in generative AI, be it in customer support, or any other domain, we feel its critical to spend the time at the start to come up with and get buy in around a metric you can use to measure the effectiveness of the result. The CIEI framework offers a detailed, quantitative approach to evaluating the impact of these technologies, enabling organizations to make informed decisions and continuously improve their operations. By leveraging this framework, our clients have been able to not only justify their AI investments but also optimize their customer service strategies for greater efficiency and customer satisfaction.
Interested in learning more about how generative AI can be deployed within the enterprise? Check out this post on how to craft a generative AI acceptable use policy for your company.